Director Dashboard
The director dashboard tracks the activities performed by governance team members by
- providing a quick glance of the governance activities that it touches
- providing a good indication of the progress being made against the company or the program-level strategy
- identifying any gaps where there is unrealized value from governance
You can view a dashboard with Syniti Knowledge Tier centric metrics and information. You must be assigned to the Director persona in Admin to access the dashboard. Refer to Add a User Account for more information. Once you have Persona set to Director, the dashboard is displayed as soon as you log in.
NOTE: The dashboard is generally updated once daily, but can be updated more frequently. Refer to the date and time stamp in the upper right corner of the dashboard to see when it was last updated.
To navigate the dashboard:
-
To leave the dashboard and access another component, for example, Strategy or Admin, click the icon in the Applications panel.
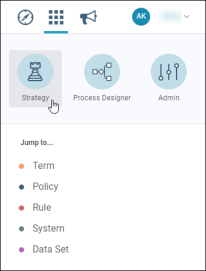
- To return to the dashboard from anywhere in Knowledge Tier, click the Syniti logo in the top left-hand corner of the page.
Strategy Metrics
The Strategy Metrics charts allow you to view the status of the assets in Knowledge Tier. This can provide you with an indicator of how well the company or program is doing in achieving its goals and initiatives.
On the status charts, you can click a status legend to remove it from the total and percentages. Click the legend again to include it.
Use the scroll options as needed to scroll and display the full list of statuses.
You can hover over the descriptions in the chart titles to show the complete description.
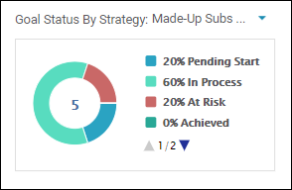
Goals Status by Strategy
You can view a percentage-based summary of the statuses of goals within a strategy.
You can select the Strategy drop-down to change the chart to show company or program metrics. Refer to Strategy for more information about company and program strategies.
In the following example, you can see that 20% of the company-level goals are in a status of “At Risk.”
You can click the number in the center of the chart to view the Goals for the company or program selected.
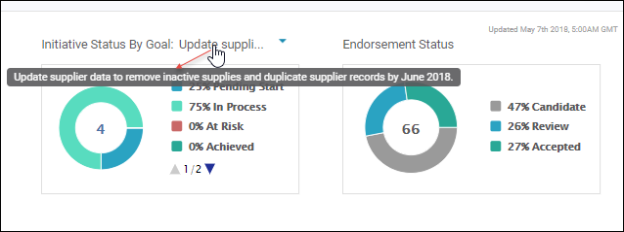
Initiative Status by Goal
You can view a percentage-based summary of the statuses of Initiatives by Goal. This chart contains metrics for all goals across all programs.
You select a goal from the drop-down to see the statuses for the Initiatives related to the goal. In the following example, you can see that 67% of the initiatives related to the selected goal are in progress.
![]()
You can click the number in the center of the chart to view the Initiatives.
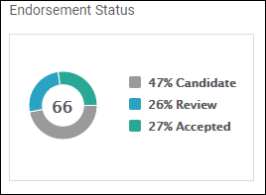
Endorsement Status
The Endorsement Status chart provides a percentage-based summary of where a company’s assets are within the endorsement workflow process.
The number in the center of the Endorsement Status chart is the total number of assets in Knowledge Tier that can be endorsed (Terms + Rules + Policies).
The percentages represent the percent of each endorsement status that exists.
In this chart you can view the following metrics:
- % of Assets in “Candidate” endorsement status
- % of Assets in “Review” endorsement status
- % of Assets in “Accepted” endorsement status
In the following example, you can see that there are 66 total assets and 27% of those assets have been accepted.
Asset Totals
You can view the total number of each type of asset that is being governed in Knowledge Tier. While the rest of the dashboard data and the number of added assets is not updated in real time, the Asset Totals counts are updated in real time.